As the calendar turns from “Way Too Early Top 25 Rankings” season to just the regular old preseason, we are slowly but surely getting back into basketball activities. I’m not referring to every player coming back to campus in the best shape of their life while hitting jumpers over assistant coaches with those blocking pads. No, I mean fans replying “[player] is about to be a PROBLEM!” to the social media posts of said jumper, becoming indignant on where your favorite team ranks in a college basketball content farm’s photoshopped list, and bullying the new kid in the metaphorical A10 Twitter classroom.
With A10 Basketball just a college football season away, it is time to dust off all the various college basketball R packages and get to some statin’. Prior to last season, with the transfer portal starting to transform into it’s final form, I used K-means clustering and principal component analysis to compare incoming A10 transfers to stalwarts in the conference by which cluster the transfer landed in. Looking back there were some comparisons that seemed pretty apt and some that didn’t fit for various reasons. With some large expectations being loaded on the shoulders of a few Atlantic 10 programs this season, I thought we could do something similar with some of the top talent of the conference.
Let me open the curtain and let you in on a little secret, many of the ideas I get for things I do on here and on Twitter come from soccer analytics twitter. There are a surprisingly large number of concepts that can crossover between the sports and having experience consulting on analytics for a few European soccer clubs it is a field I am all to happy to borrow ideas from. Today’s example of this comes from Tony ElHabr who wrote an article on his site titled “Tired: PCA + kmeans, Wired: UMAP + GMM”. In the article, Tony uses an example to show the advantages of using a Gaussian Mixture Model to try and find similar players in soccer. While K-Means clustering we used in the transfer article last season is useful, Tony is able to show why Gaussian Mixture Models make some notable improvements over it. Alex Stern also performed a similar exercise with NBA players (and most helpfully, shared his R code on how he did so), so I figured why not use GMM with NCAA basketball focusing on the A10. One of the big advantages of Gaussian Mixture Models is being able to determine the variance to the mean of a cluster, i.e. we can see how far similar a player is to the architype we find in a cluster. We can also see players from past seasons are most similar to the presumed starts of the A10 this upcoming season. The other advantage is the Gaussian Mixture Model (GMM) will also tell us the optimal number of clusters to use, minimizing the chance for operator error which may increase depending on how many times Jon Rothstein tweets “the epitome of brutality” for A10 sides in non-conference play.
“Alright nerd, what does this have to do with [your favorite team’s best player] having lottery pick talent but is definitely staying for four years at [your favorite team]?” Well friend, what if I told you I took data from every division 1 player the past five seasons to come up with a GMM, come up with 9 clusters of roles of players in college basketball with some prior A10 favorites as examples, and then found which cluster each of the returning players on the first and second all conference teams (the vague phrasing there is intentional for our friends who hate ketchup on hotdogs) belongs in and what relatively well-known prior player are they most similar to? If that sounds good to you, or at least better than anything on @CBKReport, let’s dive in!
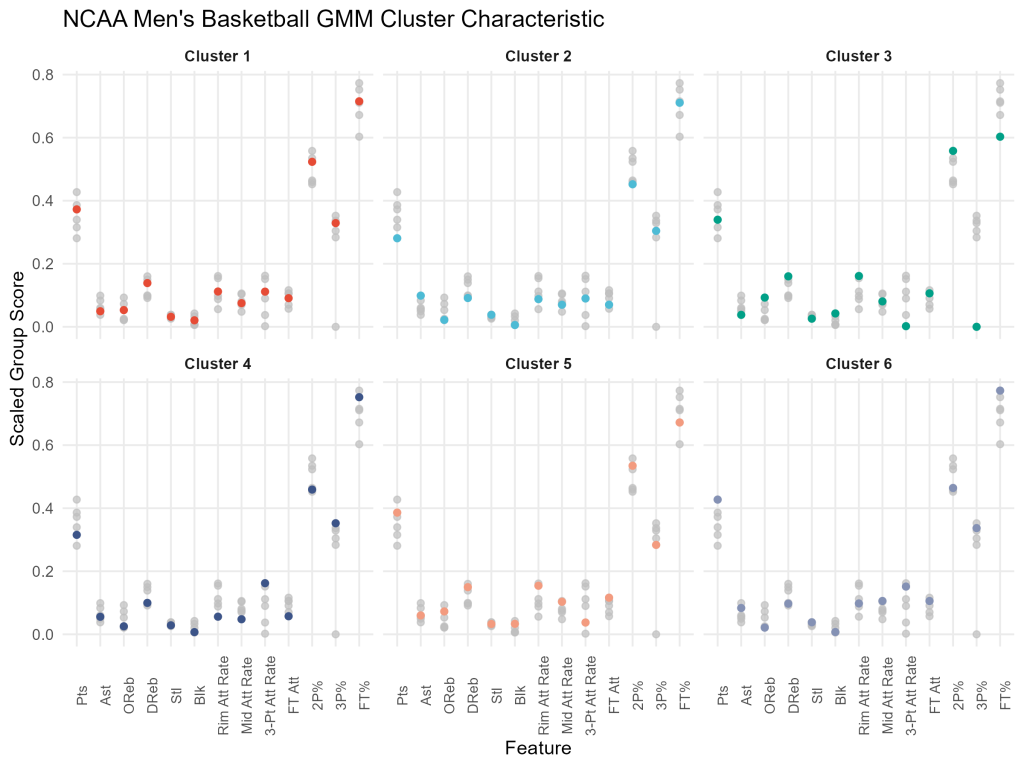
To come up with our GMM, as I mentioned earlier I pulled the data for every player who appeared in at least 15 minutes a game the past five seasons. Using point scoring, assist creation, offensive and defensive rebounding, steals, blocks, attempt rates at the rim, midrange and perimeter, free throw attempt rate, shooting percentage from two-point and three point range, and free throw percentage, we find that the optimal number of clusters for different roles for players in college basketball is nine. The visual below helps to describe those roles, with the point being higher meaning that cluster typically has a higher numbers in that stat.

We have the visual above, but what is that graph showing us about each cluster? And who are some A10 names we know that are good examples of those clusters?
Cluster 1: Rim Rattlers
-These players contribute scoring to their teams, doing it mostly near the rim. Unsurprisingly they also get plenty of rebounds and blocks. They draw plenty of fouls, though they don’t necessarily convert their free throws at the highest percentage. A10 Examples: Luka Brajkovic, Nathan Cayo, Marcus Weathers, Josh Cunningham
Cluster 2: Dynamic Guards
-Cluster 2 contains plenty of guards that can just as easily score 20 or assist 20 in a single game. These players shoot plenty of jumpers and free throws and hit a larger percentage of them. A10 Examples: Jalen Crutcher, Peyton Aldridge, Javonte Perkins, Kellan Grady
Cluster 3: Rebounding and Rim Protection
-Mostly big men make up cluster three and their primary contributions to their squads comes pulling down rebounds and protecting the rim. These players aren’t typically lighting up the scoreboard and get a nose bleed attempting shots any farther than the paint. A10 Examples: Hason Ward, Cyril Langevine, Marcus Santos-Silva, Osun Osunniyi
Cluster 4: Perimeter Shooters
-The players of cluster 4 are primarily on the court to do one thing, shoot threes early and often. Given their penchant for firing it from deep, these players also are good free throw shooters. However, these free throws are usually coming when they are fouled beyond the perimeter as they are mostly taking and making threes. A10 Examples: Ibi Watson, Blake Francis, Gibson Jimerson, Darrell Davis
Cluster 5: Lock Down Guards
-When you see the players in cluster 5 across the court, you know they are going to be an absolute pest all game long. They’ll be forcing steals and turnovers and frustrating your best player for 40 minutes. They aren’t necessarily relied upon to score many points, but they will definitely do everything they can to stop you from doing so. A10 Examples: (Fr & So Year) Jacob Gilyard, (Fr Year) Bones Hyland, Andre Gustavson, Jimmy Clark
Cluster 6: Dynamic Wings
-Some of the more well rounded players in the A10 over recent seasons are found in cluster 6. These guys are capable of scoring anywhere on the floor, can contribute defensively and on the boards in most games. The Toronto Raptors love this type of player(there was literally one on their roster last season). A10 Examples: Yuta Watanabe, Trey Landers, Jalen Adaway, Vince Williams Jr.
Cluster 7: Floor Generals
-Assisting their teammates are what the players of cluster 7 do best. They can pick a few steals, hit some shots from the perimeter and mostly knock down their free throws but they excel at finding the best shot for their teammates. A10 Examples: Kobe Elvis, Kyle Lofton, Malachi Smith, (Senior Victory Lap Year) Jacob Gilyard
Cluster 8: Floor Spacers
-These guys aren’t quite the scoresheet fillers the way the players in cluster 4 are, but they still need to be accounted for whenever they are on offense and behind the three point line. Besides offering some floor spacing, these players aren’t much of a threat to score but can certainly knock down a jump shot from anywhere on the court. A10 Examples: Ryan Mikesell, Taylor Funk, KiShawn Pritchett, Hyunjung Lee
Cluster 9: Well Rounded Unicorns
-I’ll be honest, it took me the longest time to come up with a title for this cluster. From the chart above, we see characteristics of a player who can contribute in numerous ways without necessarily excelling in any of them. After looking at the A10 players in this cluster, we see a bunch of guys that seem unique to the conference. A passing big man like Grant Golden, a rebounding guard like Jordan Goodwin, etc. A10 Examples: Grant Golden, Jordan Goodwin, Justin Tillman, Fred Thatch Jr.
So our Gaussian Mixture Model has given us 9 clusters of NCAA basketball players. Which clusters do some returning Atlantic 10 stars fit in and who are some players in their cluster they can compare to? Lets look at each of the players who finished in the top two all-conference teams (even if that conference was the MVC).

First we’ll look at George Mason big man Josh Oduro. Last season Oduro’s performance put him into Rim Rattlers cluster. The A10 First Teamer took over 52% of his shots last season at the rim and scored on nearly 70% of them. Oduro also pulled down an 8.5% offensive rebound rate and 19.8% of defensive rebound rate last season as well as putting up a 6.9% block rate. Some of the players in NCAA Division 1 the past five seasons that are the closest to Oduro in our model are Grant Williams from Tennessee, Josh Cunningham from Dayton and Chimezie Metu from USC.

Next we have Saint Louis point guard Yuri Collins who unsurprisingly falls into the Floor Generals cluster after leading the country in assists. It is well known that Collins led the country in total assists last season, which fits in well with our Floor General category. The Junior averaged 1.93 assists to turnovers last season and pulled in nearly 2 steals a game. The players that Collins was most similar to in his cluster was Nigel Johnson at Virginia, (somewhat ironically) Jourdan Grant who’s UMBC team beat Johnson’s Cavaliers and Zavier Simpson from Michigan.

Foster Loyer helped lead Davidson to a regular season conference title last season and the returning senior played his way into the Dynamic Guards cluster. Moving from Michigan State to Davidson, Loyer increasing his scoring per game from 4.16 points per game to 16.14 points per game. He shot 43.8% from three point range and saw his effective field goal percentage jump up over 15% to 57.1% last season. Similar players in Foster Loyer’s cluster include St. Bonaventure tormenter AJ Green of Northern Iowa, Collin Sexton of the Alabama Crimson Tide (and the NBA!) and Kendric Davis of SMU.

Atlantic 10 Rookie of the Year DaRon Holmes also was in our Rim Rattlers cluster in our model. Holmes had a spectacular freshman season for the Flyers and is the most likely NBA prospect for the conference before we tip off this season, but it is at this point I’d like to clarify that a Gaussian Mixture Model will give us the variance to the center of the cluster, thus how we determine players that are similar to the ones we are examining. This isn’t to say that a player will definitely follow the path of a player near them in their respective clusters. With that being said, DaRon Holmes was an impact freshman who used his length and size to become a force on both sides of the court, much like cluster neighbor Chet Holmgren who our model says Holmes was similar to. Along with the now injured NBA lotter pick, Holmes also was similar to Duquense’s Michael Hughes and fellow Flyer Kostas Antetokumpo.
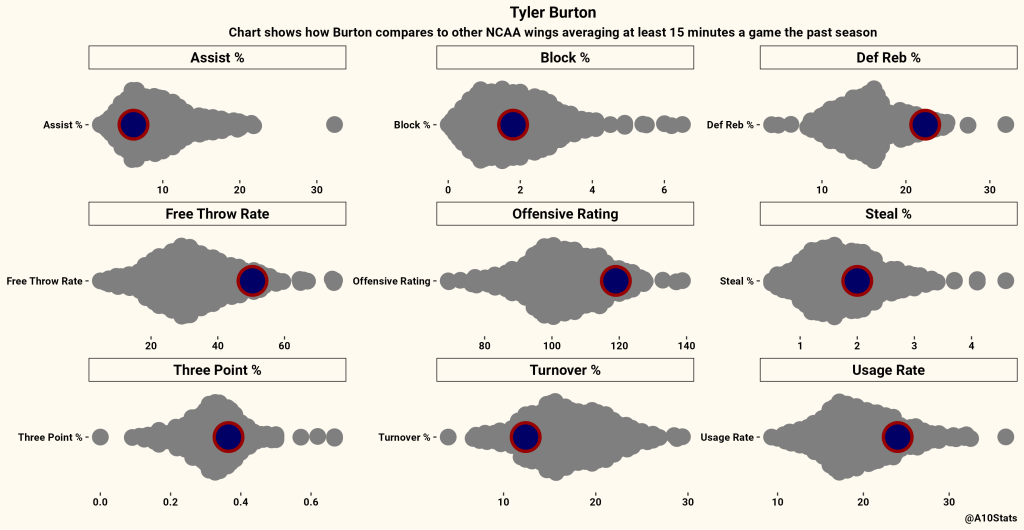
DaRon Holmes might be the best candidate to go to the NBA, but Richmond’s Tyler Burton is certainly capable of making the A10 to NBA leap after this season as well. Burton is in our Dynamic Wings cluster and it’s that dynamic play that makes him a possible draft candidate. The Richmond junior had the highest usage rate of his career of 24% while still being the most efficient he has been scoring in his time with the Spiders, putting up a true shooting rate of 58.6%. He scored 71.43% of his rim attempts last season while also hitting 36.5% of his threes, showing his ability to score anywhere on the court. Similar players in the same cluster to Burton is Ron Harper Jr. of Rutgers, Brady Manek of North Carolina and Josh Okogie of Georgia Tech.

Where he falls in the rankings of top A10 point guards was the subject of much debate last season, but our model puts VCU’s Ace Baldwin into the Floor General cluster. It was night and day for the Rams offense last season, and their improved offensive performances coincided with Ace’s return to the VCU lineup. When he was in the lineup, Ace had an assist rate of 32.8% and averaged 1.69 assists to turnovers last season. His impact is best shown when looking at VCU’s offensive ratings when he was on and off the court, as the Rams averaged 105.05 points per 100 possessions with Ace and 85.65 points per 100 possessions without. The Rams guard is neighbors in our Floor General cluster with players like TJ Haws of BYU, Jordan Goldwire of Duke and Oklahoma and Zavier Simpson of Michigan.

Finally, the Loyola Ramblers have one returning all-conference player in Braden Norris. The guard will help the lead the Ramblers into Atlantic 10 play and he will be well suited to be that leader since he is in our model’s Floor Generals cluster. Norris averaged nearly 4 assists a game and had an assist rate of 22.4% last season, top for any Loyola player last season. In a conference full of good point guards, Norris will be the player the Ramblers rely on to keep things running in their maiden voyage in the Atlantic 10. Our model offers Baylor’s Davion Mitchell, Courtney Ramey of Texas and Connor McCafferty of Iowa as comparable players to Norris.
As we get closer to the start of a new season, it is only natural that optimism is high for all. Everyone can see a path to improvement for our favorite school and even the most pessimistic of us can picture things working out. While player development isn’t linear, with some stats and modeling, we can start to put the pieces together on what to expect from our teams this winter and spring.

Leave a comment