Atlantic 10 basketball continues to inch ever closer to getting underway, we have officially entered the unbridled optimism phase of the offseason. Every player in the conference has seemingly added muscle and gotten leaner, unleashed a new weapon on offense, and really taken things seriously on the defensive end of the court. With every player coming back to campus in the best shape of their life, are we destined for every school in the A10 finishing .500?
While plenty of returning players might be the “best versions” of themselves, the easing of transfer restrictions means there will be plenty of new faces among the 14 institutions of the Atlantic 10 this season. Predicting how those transfers will fare at their new team can be a bit of a crap shoot. We have all seen former “power conference” players fail to make an impact while guys who “transferred up” to the A10 became all-conference players. Of course we have also seen the inverse where guys previously at big schools came in made their mark while players who lit up the scoreboard at smaller schools couldn’t quite hack it in a “Power 8” conference like the Atlantic 10.
With such mixed fortunes for transfers in the A10, could we try to use data to project the success of the latest crop of transfers? Maybe, but I’m not brave enough to try! Rather than try to predict whether or not these new arrivals to the conference will be successful, we can instead use their stats from last season to try to classify how stylistically they will play. Instead of forcing ourselves to watch some footage of Albany, Georgia or Ball State, we can use an “unsupervised machine learning algorithm” called k-means clustering to accomplish this. This will give us help us categorize groups of Atlantic 10 players last season and some of the transfers in the conference, so we can see what type of player these new arrivals are and get a player from last season to compare for a frame of reference.
Before we create the clusters, we need to decide how to measure the players. Basketball is a game that provides plenty of numbers we could try to use for both offense and defense. We can measure how efficient players are on offense with stats like effective field goal percentage. We can count where players typically take shots. Even on the defensive end we can get an idea of a player’s defensive prowess with stats like block and steal rate. With some many numbers available to a slightly better than mid-major basketball fan, how do we decide what to use for our purposes here?
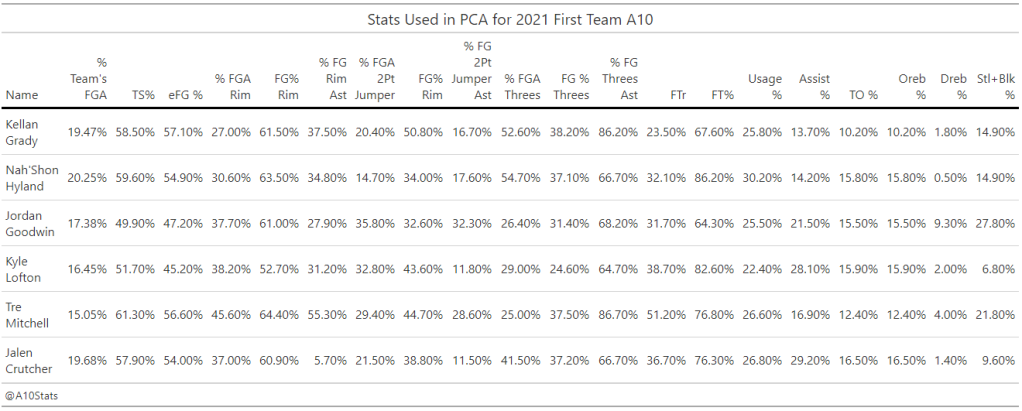
We use principal component analysis to reduce the variables while still preserving most of the information, of course! We take every A10 player who took at least 50 field goal attempts last season and the 15 transfers SBUnfurled highlighted in this tweet above and gather some data. We can use common stats like eFG%, shooting % at the rim, mid-range and three and block and steal rate, as well as less traditional stats like the percentage of a team’s field goals a player took for our purposes here. We take these numbers and put them into a PCA to get us new variables.
With these new variables from our PCA we can start to form our clusters. After using the “elbow method” and observation to determine how many clusters to use in our k-means clustering algorithm, a few lines of code helps us to fill out our seven clusters of A10 players from last season and the transfers. Things like “machine learning” and “algorithms” can be intimidating, but the goal of k-means clustering is simple: to group similar data points together and discover underlying patterns. In our case here, we are going to group similar basketball players together to try and better understand just how some of the new faces in the Atlantic 10 will play.
Now before we dive into the results I want to first preface them by emphasizing these aren’t projecting talent, skill, or results. Rather these will give us an idea of how some of these players could play. If I took played in a similar style to Obi Toppin during his time at Dayton, the results would be very different. Furthermore, since our focus is on transfers it is worth noting that a change in system can see someone play in a different way than they had even in the previous season. This isn’t meant to be an exact science, but like most data related pursuits, to utilize the information we have to try and provide insight. So on with the results.
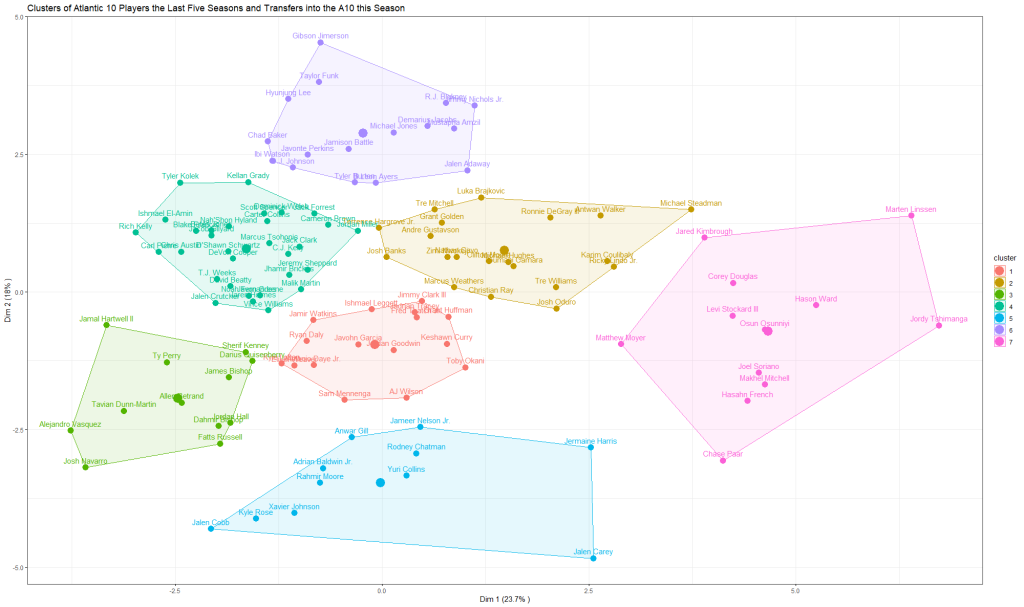
The only transfer we see in cluster one is former FIU guard Antonio Daye Jr. who is headed to Rose Hill Gym to join Fordham. The closest comparisons our clusters have for Daye is Elijah Weaver of Dayton and Kyle Lofton of St. Bonaventure. All three weren’t the most efficient scorers last season but had plenty of assists, so we might guess that Daye would be looking to set up his Fordham teammates first before looking for his own shot this season.
Cluster 2 is home to four incoming Atlantic 10 transfer players. This includes big names Toumani Camara and Karim Coulibaly who are off Dayton and St. Bonaventure respectively, as well as Michael Steadman and Tre Williams who will be playing for UMass and Duquesne this season. Looking at their neighbors in cluster 2, we see plenty of guys who score a lot at the rim and are active on defense and pull down plenty of rebounds. Without getting too technical, each cluster in a k-means algorithm has a centroid and allocates all our data points, or in case players, to the closest centroid. You’ll notice in our cluster here that former Duquesne player Michael Hughes’ name is near the largest point, which is our centroid. In other words, the explosive slashing former Duke is a good representation for many of the players here.
The former Georgia Bulldog and future Flyer Toumani Camara’s closest comparison is indeed Hughes, which will surely be welcome news to Flyer fans who saw UD’s field goal percentage at the rim drop by over 5% from the 2019/20 season to last year and were ranked 216th in the country in offensive rebound rate allowed. According to the algorithm, Tre Williams was most similar to Josh Oduro of George Mason, Karim Coulibaly was most similar to Antwan Walker of Rhode Island and Michael Steadman was most similar to Ricky Lindo Jr. of George Washington. Coulibaly could be another shot blocking menace that Mark Schmidt and the Bonnies can unleash either alongside of Osun Osunniyi or while the all-conference Center gets a breather.
Darius Quisenberry is the only transfer populating cluster 3, and the former Youngstown State player will be another reinforcement for the Fordham backcourt. You have probably figured that cluster that features Fatts Russell means many of the other players in entails take plenty of shots from the perimeter. That is the case for Quisenberry, who’s closest comparison is Sherif Kenny from La Salle.
Six transfer debutants make up cluster 4, with C.J. Kelly, Marcus Tsohonis, DeVon Cooper, D’Shawn Schwartz, Ishmael El-Amin and Rich Kelly all going to UMass, VCU, George Mason, and Rhode Island respectively. Of all the results, this cluster has some of the most interesting comparisons to players from last year. We see this cluster is full of dynamic guards who can both score and be a playmaker for teammates as well. We see a few of these transfers near some very exciting names as a comparison on our cluster graph such as Bones Hyland, Jalen Crutcher, Kellan Grady and more.
Duquesne newcomer Leon Ayers and VCU transfer Jimmy Nichols Jr. are the only incoming transfers to the Atlantic 10 that finds themselves in cluster 6. This might be good news to Dukes and Rams fans, as the defining characteristic of this cluster is the high efficiency the players in this cluster had scoring last season. Ayers closest comparison to an A10 player last season is Richmond’s Tyler Burton, who cliché robot Jon Rothstein highlighted as a under the radar breakout player on the 3 Bid Podcast. The algorithm closely compares Nichols to Dayton players RJ Blakney and Mustapha Amzil, who showed both showed flashes of efficient scoring at the rim and from the perimeter last season. Along with Burton and Amzil, many of the other players in cluster 6 like Javonte Perkins and Hyunjung Lee were some of the most productive scorers in the conference last season. Could Ayers and Nichols join this group of talented offensive threats in the A10? The algorithm certainly thinks so.
Finally, while none of the incoming transfers we examined here find themselves in cluster 7, I wanted to note that like Mike Hughes did for cluster 2, St. Bonaventure’s Osun Osunniyi is basically the centroid for our big man cluster here. All the other big men in cluster 7 are mostly consistent in the way they play, blocking shots, grabbing rebounds, and scoring at the rim. The Bonnies big man ability to excel at all these facets of the game makes it easy to understand why our k-means algorithm seems to find him as the “ideal” A10 big man.
We are so close to being able to answer just how these incoming transfers will do with our eyes rather than asking algorithms to guess. It’s become a cliché to discuss how weird college basketball was last season, but it seems like multiple incoming and outgoing transfers from each team will be the new norm. Luckily it is also paired with the new normal of available data that helps us try to guess just how those players will do at their new homes.

Leave a comment